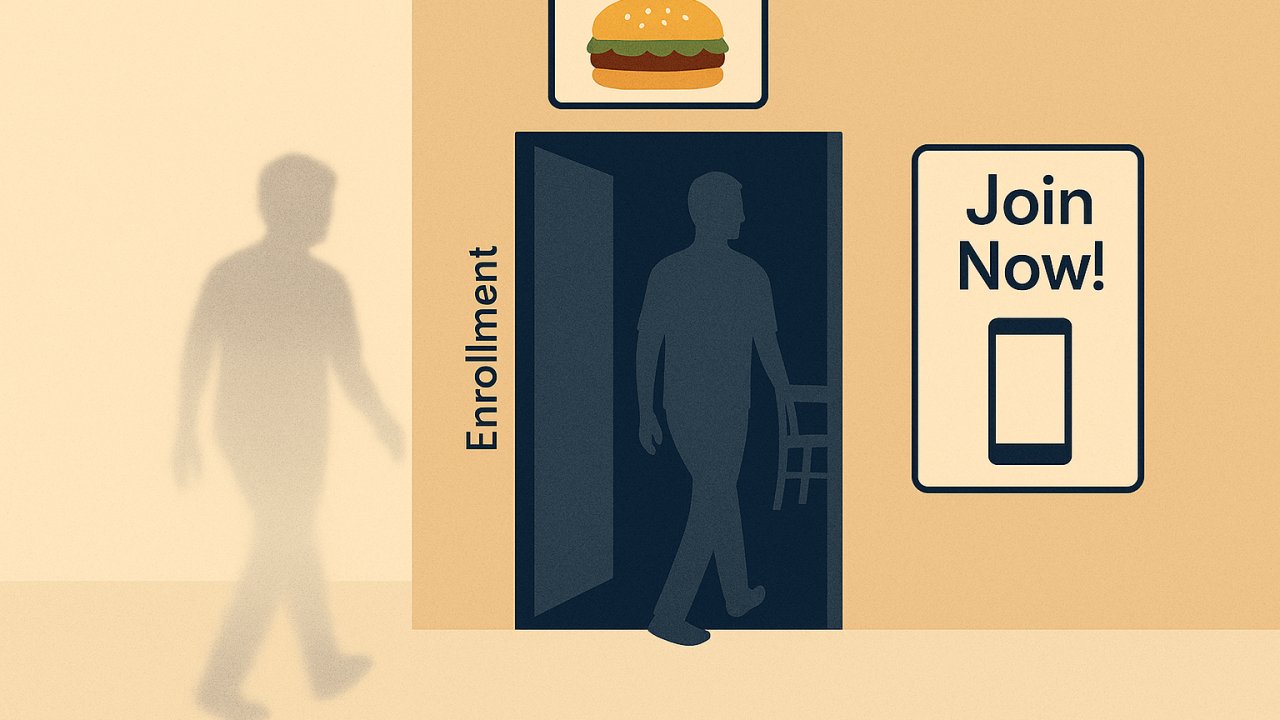
A few weeks ago, I challenged a metric that no one in the QSR loyalty industry seems to question: McDonald's claim that loyalty enrollment drives a staggering 150% surge in customer frequency – moving a guest from an average of 10.5 visits to 26 visits annually when they join MyMcDonald’s Rewards. On an earnings call, this sounds like a revolution. In a boardroom, it’s a miracle. But in the messy reality of data science? It looks like a classic case of selection bias, combined with some imprecise tracking.
I thought I was done with this topic, but some feedback I received suggested I do a little more validation. So this is the first in a five-part series this week, in which I’ll cover:
Why selection bias is an important consideration
Validating by looking at member/non-member behavior in a mature program like Chipotle Mexican Grill
The mathematics of how much incremental spend is possible for a loyalty program
The post-launch timeline and results
Action steps to take now to be successful in 2026.
(After this, I’ll turn my focus to other topics.)
The starting point is this: I am a fan of loyalty programs. Executed properly, I know they can drive profitable, incremental spend by motivating engagement over a sustained time horizon. I’ve just been troubled by the sameness of all the programs (e.g., last time I checked, 307 of the top 500 restaurant chains had loyalty programs, and 229 of those, or 75%, used some form of “My ___ Rewards”), commonly quoted rules of thumb with no factual basis, and reported stats, like McDonald’s, that seem like extreme outliers compared to the brands and programs with which I’ve been involved.
Let’s start again with the McDonald’s stats, and think about the "who" before the "how much." The fundamental flaw in this narrative?
pre-enrollment (10.5 annual visits) --> post-enrollment (26 visits)
It's the blanket nature of the statement. Is this true throughout the entirety of the McDonald’s user base? Not likely. Consider this one-tail distribution of QSR customer frequency (source: Nation’s Restaurant News).
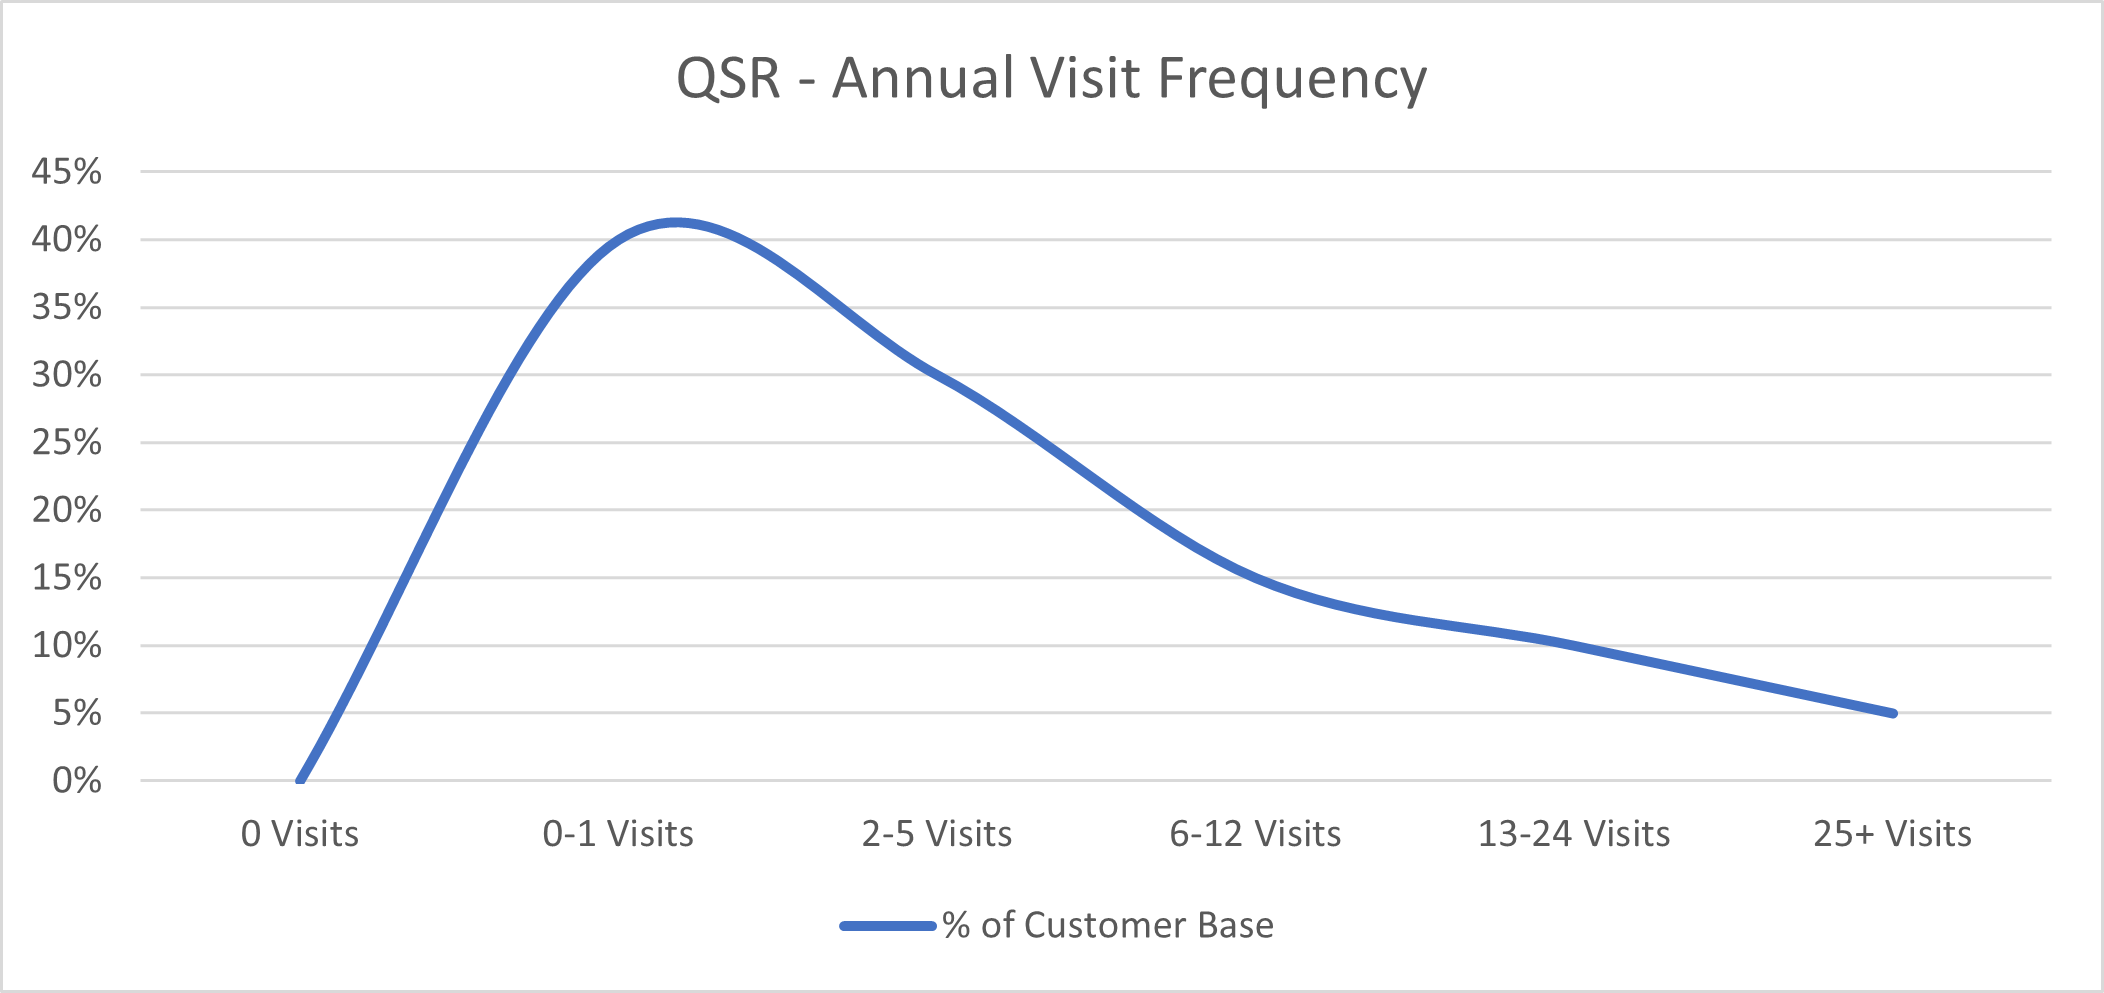
This chart doesn’t use McDonald’s data, but I suspect their curve is probably similar in shape, maybe with somewhat higher numbers for the buckets. But this raises two concerns.
Selection Bias. The person who downloads a brand's app on day one isn't the casual, twice-a-year diner on the left side of the chart; it’s the "Super-Fan" on the right hand of the chart who already eats there twice a week. So adoption is likely to move from right to left. Those on the right side are most likely to join the program, but least likely to have the headroom to increase visits. And there aren’t that many of them. Those on the left side are least likely to join the program, but have the most headroom for growth. There are a lot of them, but joining a loyalty program is unlikely to move them far to the right over a short timeframe. (The overall weighted average from the chart is 6.28 annual visits, so potentially the McDonald’s stat comes from their own chart similar to this. Among low frequency visitors, the average is only 2.2 visits per year, so for them to double visit frequency seems possible, although doubling the overall average visit rate seems like a stretch. Among higher-frequency visitors the average is 16.8 visits, so doubling that average seems unlikely; even though in order to make the McD’s math work, this is where the increase would have to present itself.)
The Tracking Fog. Here is the problem every retailer faces: tracking "pre-member" behavior is notoriously difficult. By definition, an anonymous customer is a ghost in your system. Unless there is an existing private-label credit card or a mechanism for meticulously stitching together credit card hashes, a process prone to decay and noise in the data, it is difficult to truly know how often that "new" member was visiting before they joined your program.
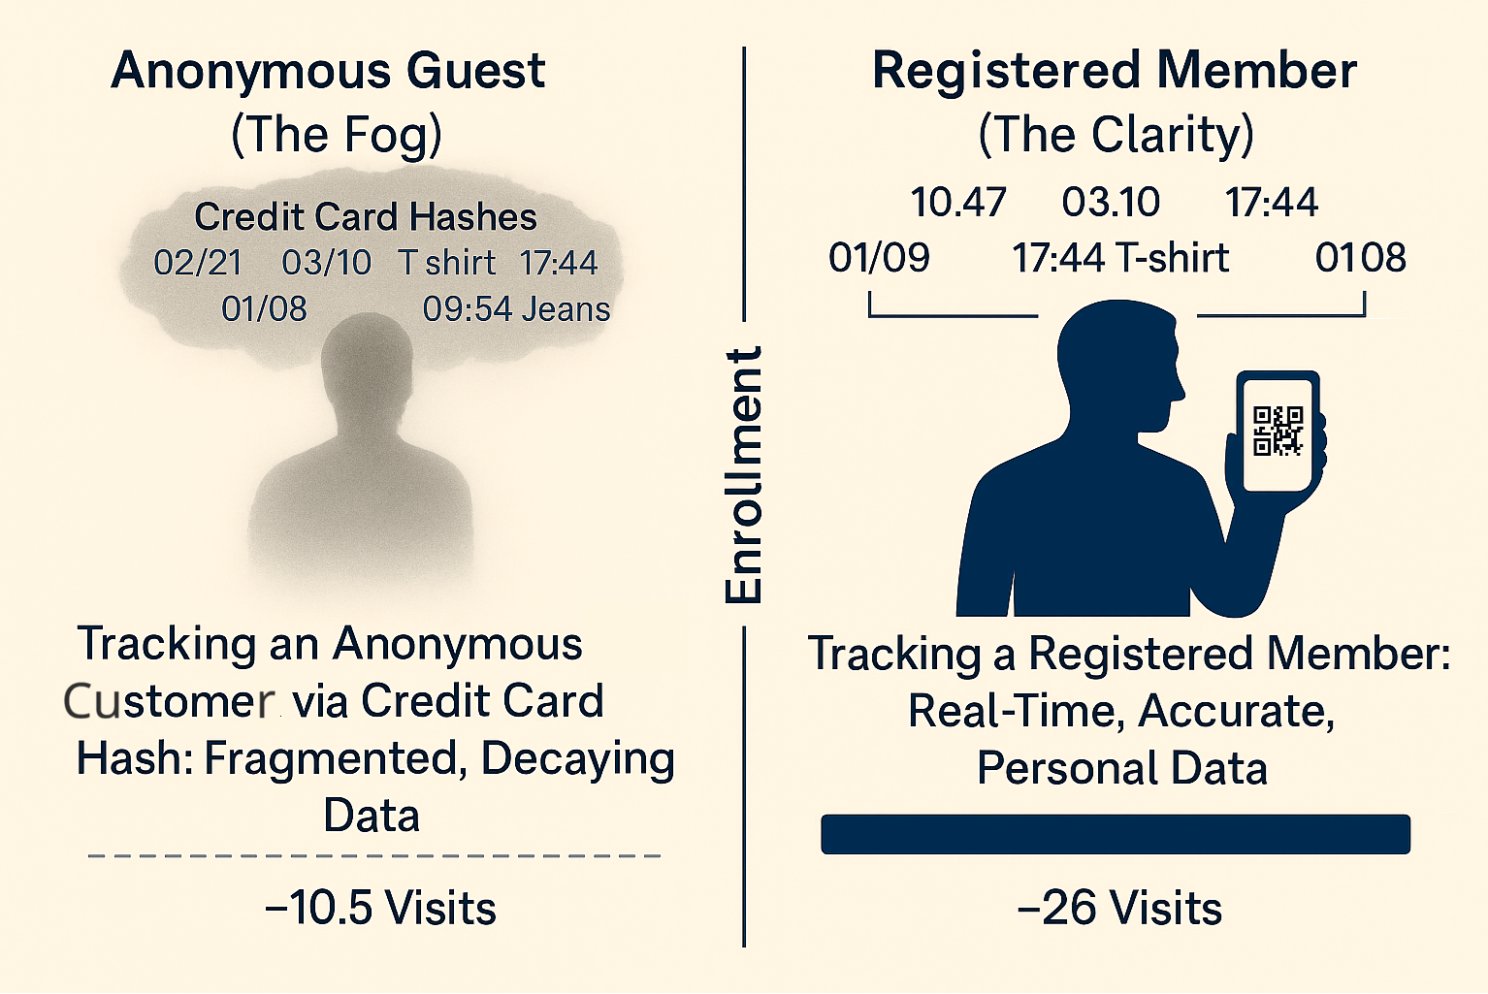
When a CEO says a member jumped from 10.5 to 26 visits, they may be comparing an average sourced from a fragmented, largely anonymous transaction history against a perfectly tracked, individualized digital future. But loyalty programs are opt-in. When that fan finally registers their behavior by enrolling, the company’s data engine only sees their post-enrollment behavior, and even if they perform backward linking by credit card match, they are unlikely to capture a full picture. The newly-visible high frequency is often a result of measurement capturing behavior, not the program modifying it."
It is almost impossible to accurately measure the true lift that comes from joining a program because the act of joining is usually triggered by an existing high level of affinity. An alternate, more honest measurement of the program’s impact might involve comparing a member's first three months of behavior against their next three months. If the program is a true frequency engine, we should see sustained growth or a new plateau. If it’s just a registration event, we’ll see that high frequency was there from the start and simply leveled off. But this approach still doesn’t resolve the pre-enrollment/post-enrollment challenge.
The key takeaways: Don’t benchmark against industry rules of thumb if you don’t know the source of the data. And if you don't account for selection bias in measuring post-enrollment impact, you might risk spending millions in marketing capital chasing a phantom lift that was already baked into the baseline.
Tomorrow, I’m going to put these theories to the test by looking at one of the most transparent, mature programs in the industry: Chipotle. If the 2.6x miracle is real, we should see it in their top-line. (Spoiler: The math tells a different story.)
View original on LinkedInWant to discuss this further?
Our team thinks about these problems every day. Let's start a conversation.
Book a discovery call