Previously (https://www.linkedin.com/pulse/can-we-get-better-benchmark-loyalty-program-impact-than-keenan-fe7ze/), I proposed a simple model to establish "goal posts" to put bounds around the potential impact of loyalty programs, given overall penetration and sales lift from members vs. non-members. In context of real-world results, it suggests that industry rules of thumb might be a little optimistic: 20% lift in sales vs. non-members, and an overall revenue lift of 15-25%, may be more than you can expect. An expected revenue increase in the range of 3-8% might be more realistic for most stores, based on real-world observations.
From my experience, it is very difficult to measure the revenue lift from program members vs. non-members once a program is in market – you may be able to look at individual transactions, but it is challenging to aggregate non-member visits over time. Are there any other ways to get a quick and reasonable assessment of the impact of loyalty programs, as a way of benchmarking? Might there be data out there that companies are already reporting that could give us at least a directional indication of how some of these marketing tactics are working in practice?
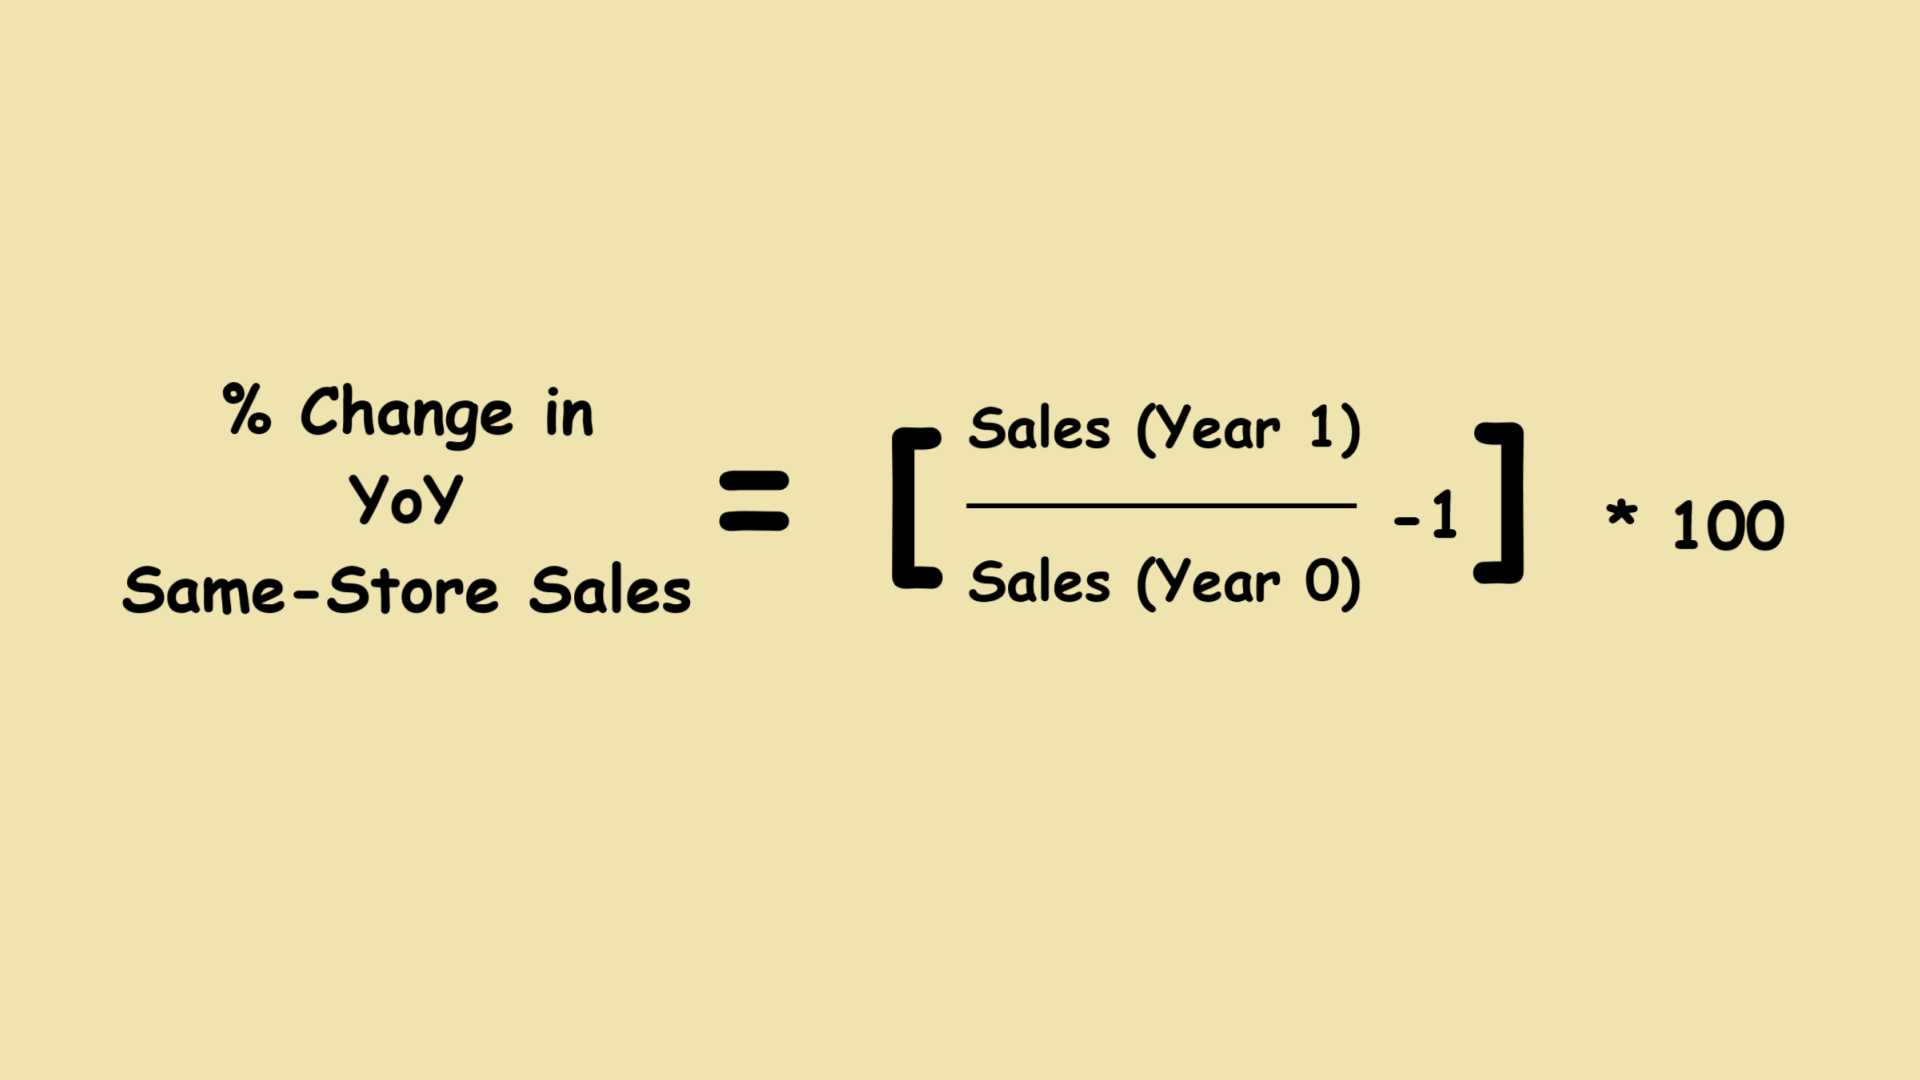
In the retail and restaurant verticals, year-over-year change in same store sales (SSS) is a metric that is commonly reported, because it isolates the performance of a single location over a defined period of time, filtering out the effects of store openings and closings on overall revenue.
My hypothesis is that SSS could be used as a proxy to, at a very high level and in combination with an understanding of the upper bound on incremental sales, gauge the impact of a broadly-used marketing tactic, such as deploying sophisticated personalization or launching a loyalty program.
Increasing SSS would be one indicator that a marketing tactic is having a positive impact, especially if you look across time (pre- and post-launch), while decreasing SSS might merit deeper investigation, because the explanation that “hey, it would have been worse if we hadn’t done anything” isn’t really measurable. I realize this is not a scientific approach that’s going to allow isolating the impact of a specific tactic and filtering out the noise from things like unrelated promotions, competitive promotions, the general economic climate or other externalities, but it might provide directional insights.
So if SSS might be a reasonably good proxy, what would we find if we looked at some real-world results? I decided to start with restaurants, identifying all the publicly traded restaurant companies in the US and gathered quarterly SSS data from their annual reports for the period from Q1 2021 through Q1 2025, covering more than 40 chains. I calculated and plotted averages as shown below, ensuring that results were properly categorized according to when the chains launched their programs. “Date-Adjusted” means their results would be aggregated into Rewards or Non-Rewards depending on when their program launched. I excluded two chains, Wingstop and Texas Roadhouse, because their outsize recent results (well-documented and both without rewards programs) were distorting the averages.
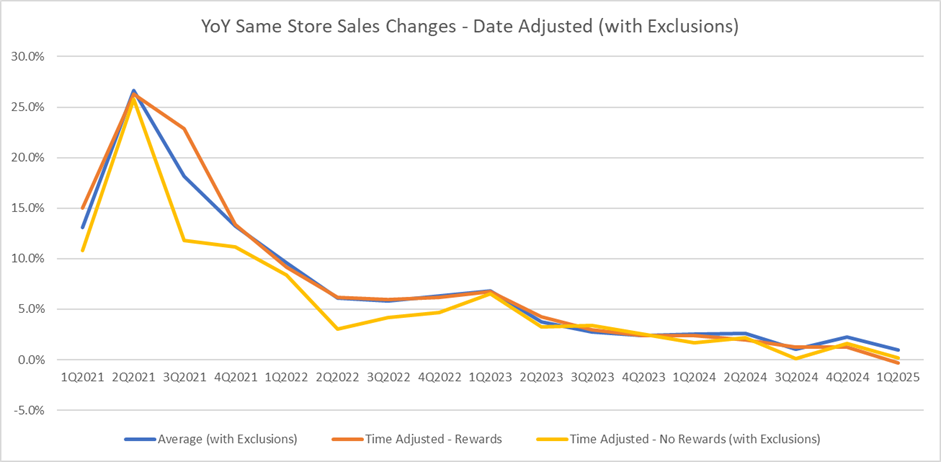
What’s going on here? The outsized 2021 results are an anomaly because it was a comparison against 2020, when the entire industry was disrupted. In 2021 and 2022, chains with rewards programs outperformed those without, but that changed in 2023, and there has been little separation since. (The number of chains adopting programs has some impact here – of the 40 chains in the dataset, 20 had programs as of the end of 2020, 26 as of the end of 2022, and 30 as of the end of 2024.) There is a noticeable downward trend starting in 1Q 2023, again not surprising given the well-documented challenges the industry has faced over the past several years.
With regards to loyalty/rewards programs, these results suggest there is a detectable surge in SSS results for one-two years after a program launches, after which the impact wanes.
This is reinforced by the observation that SSS is less than 5% for most of these chains in 2023 and 2024 – going back to the model we explored previously, that means there can't be much of a spending lift among program members.
I wonder if we would see the same thing if we looked at retail.
In any event, this is concerning if you are responsible for a loyalty program, and somewhat at odds with the rosy picture being painted in industry interviews and trade publications about the positive impact of increasingly sophisticated engagement and personalization efforts around loyalty programs, but seems to be in line with the views of industry expert Phil Rubin, (see here for an entertaining interview: https://thewisemarketer.com/loyalty-unstuck/), who says,
Loyalty is stuck for some very good reasons, namely people, priorities and platforms (technology).View original on LinkedIn
Want to discuss this further?
Our team thinks about these problems every day. Let's start a conversation.
Book a discovery call