In the first two posts in this series (here and here), we considered the psychology of selection bias and the logic gap in McDonald's reporting and Chipotle Mexican Grill ’s loyalty member growth/associated transaction decline. Today, I want to suggest a simple tool to help set realistic expectations for your own program.
The Provenance of a Myth Almost every article you read about loyalty contains a line stating that "members spend 15–20% more than non-members." No qualifications. No limitations. Any brand, any category.
Back in July 2025, I tried to find the source of this "fact." Despite extensive searching, I couldn't find a single recent, rigorous study. It appears to be based on narrow statements from a couple of consulting companies over a decade ago, repeated so often they became "truth" (the "McKinsey says..." phenomenon).
The bottom line from a cursory review of these commonly quoted stats: there isn’t really a strong foundation to believe that they are relevant today.
The Mathematical Reality Even if we assume "20% more" is true, it is being dangerously misinterpreted. Too many practitioners interpret this to mean they should expect a 20% increase in total top-line revenue. When that doesn't happen, they lose their minds.
But as we’ve established, any observed loyalty lift is a cocktail of selection bias (your best fans join first), channel markup (digital price hikes), and some level of incremental spend. It tells you who your best customers are, but it doesn't tell you what your program did.
The Incremental Yield Tool To get closer to the truth, you must think about incremental yield as an upper bound. If we strip out store expansion and price hikes, what is the actual behavioral lift per member required to justify your investment?
Here is how you apply it:
The Baseline: Index your pre-program transaction volume to 100.
The Member Penetration: What % of transactions are tagged to a member?
The Yield Solve: What is the maximum lift members could deliver to reach your current total index?
Here is the formula:
Incremental Yield = % of Revenue from Non-Members * Baseline Value +
% of Revenue from Members * (Baseline Value + Loyalty Lift)
I said it was simple. At least in theory. What it does do is set an upper bound on what you should expect. Let's do a sense check. If you claim a 20% lift and 30% of your customers are members, your total growth in revenue should be capped at an index of 106.
If your transactions are actually at an index of 102, your real behavioral lift is 6.6%, not 20%.
Why the Ceiling is Lower Than You Think See the chart below. Even with a generous 20% behavioral lift, you only see a total revenue index of 120 when 100% of your customers are members. And as we know, that doesn't happen.
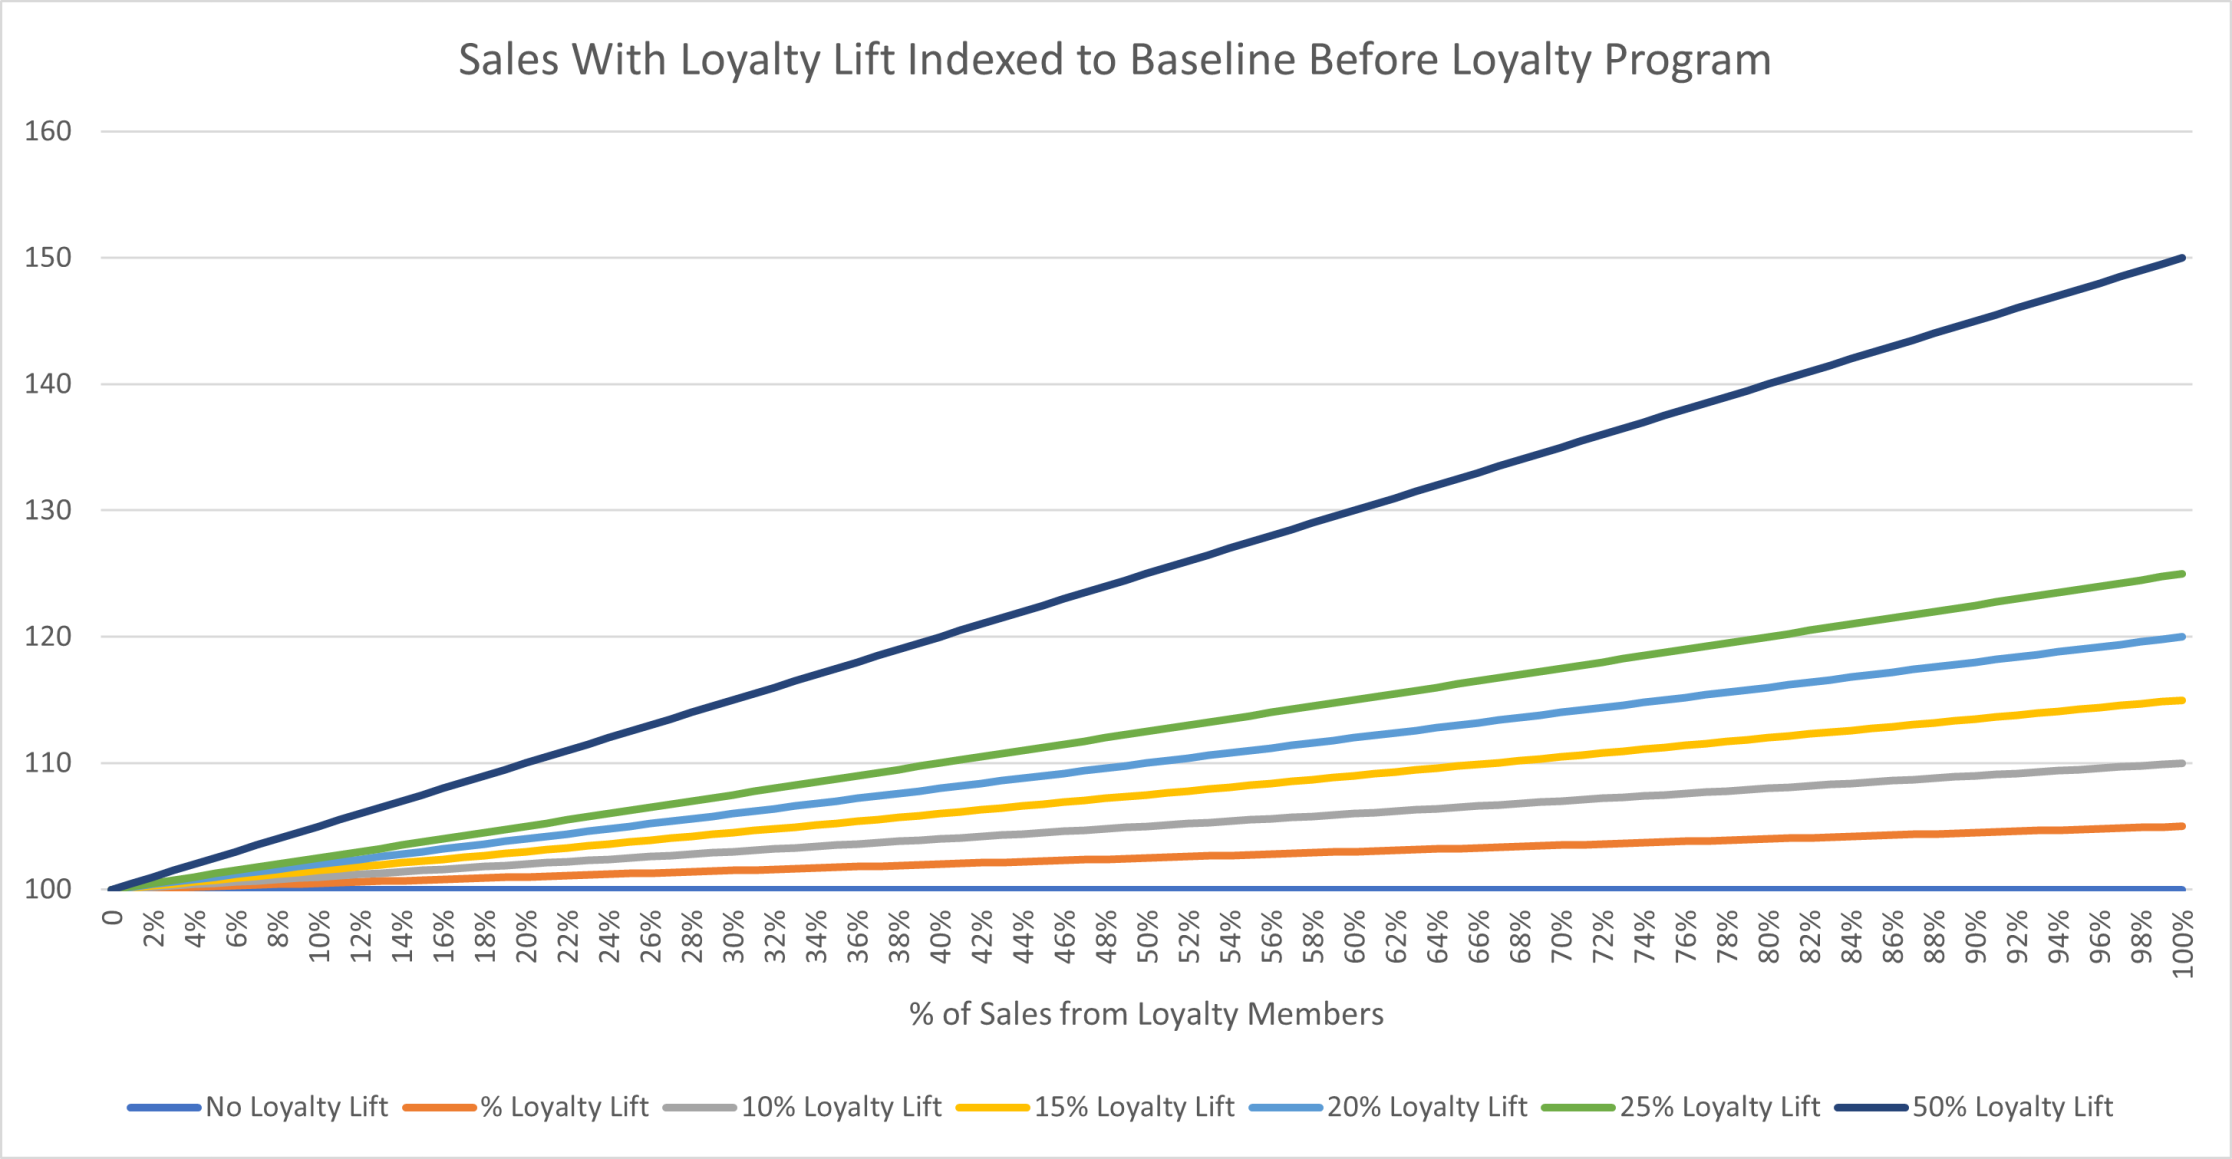
Since most QSRs hover between 25% and 40% penetration, the mathematical ceiling for loyalty-driven growth is still under 10% of total same-store sales at 40% penetration with a 20% lift, but more likely between 3% and 8% at lower sales lifts.
Smart Interpretation: The danger of over-reporting loyalty lift isn't just academic; it’s a capital allocation risk. Think about McDonald's. If they believe their loyalty program is driving a 2.6x frequency lift, they will over-invest in points and rewards and under-invest in product quality and customer engagement. That's chasing a phantom.
In Post IV, we’ll look at the “90-day sugar high" - examining a chart that proves why some execs get fooled by launch data - and why those results almost always revert to the mean.
View original on LinkedInWant to discuss this further?
Our team thinks about these problems every day. Let's start a conversation.
Book a discovery call