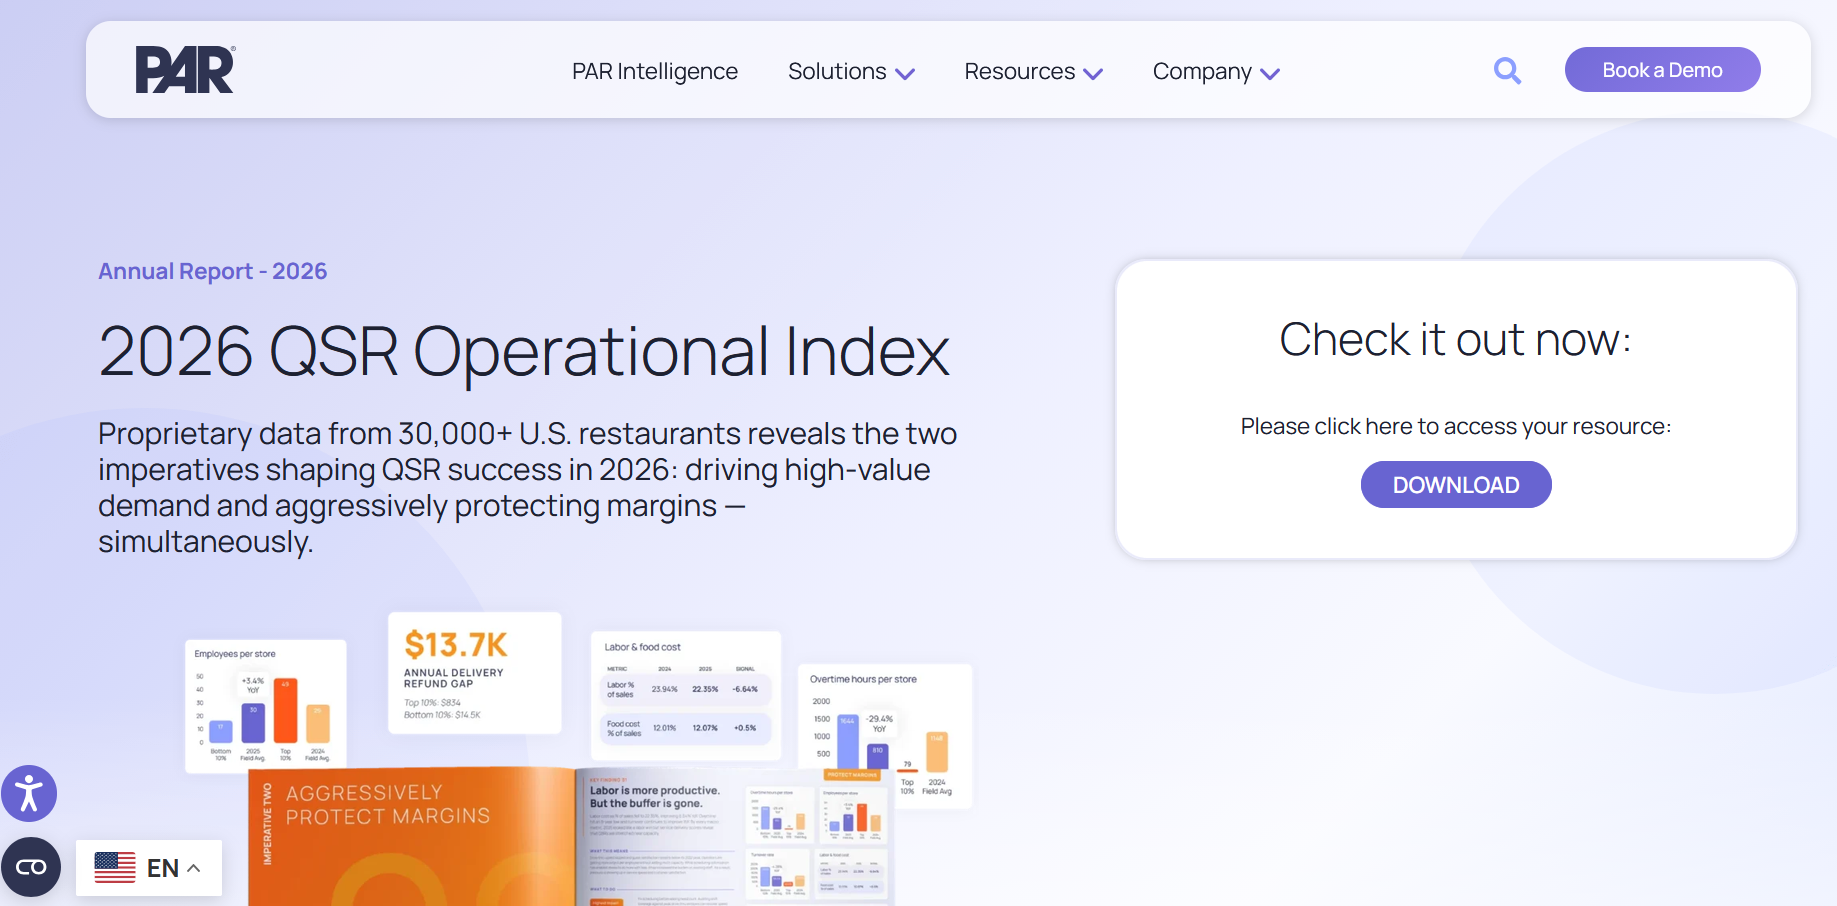
Sigh. Vendor reports love a bold headline, like this one from MediaPost even if it might be a little off the mark. PAR Technology 's latest 2026 QSR Operational Index (https://partech.com/resource/2026-qsr-operational-index/), boldly declares that "Loyalty is now the primary growth engine" and points to loyalty sales and transactions heavily outpacing anonymous business.
I realize it is in PAR’s interest to tout loyalty successes, but if you look past the splashy graphics and dig into the actual numbers, the math tells a somewhat more sobering story.
I’ve addressed this same issue numerous times in past, suggesting that the broad-brush “loyalty is driving QSR growth” narrative is tough to support given recent YoY same-store-sales reports, but worth asking again: are we just observing a massive data migration or surfacing an issue with attribution?
At the risk of being somewhat repetitive, albeit important to reinforce, here are a few reasons why we should treat the "loyalty-as-a-savior" narrative PAR is presenting with a healthy dose of skepticism.
1. The $0.26 Premium Isn’t Really Worth Much (A 1.8% Reality Check)
The report highlights that the average loyalty check size ($15.08) has officially surpassed the anonymous check size ($14.82).
That sounds like a win until you calculate the difference: it’s a mere 1.8% premium. That could just be noise in the data. But it means loyalty isn't driving much growth. In fact, it is fairly easy to plot the expected impact of the loyalty lift and gauge if it is truly driving topline increases.
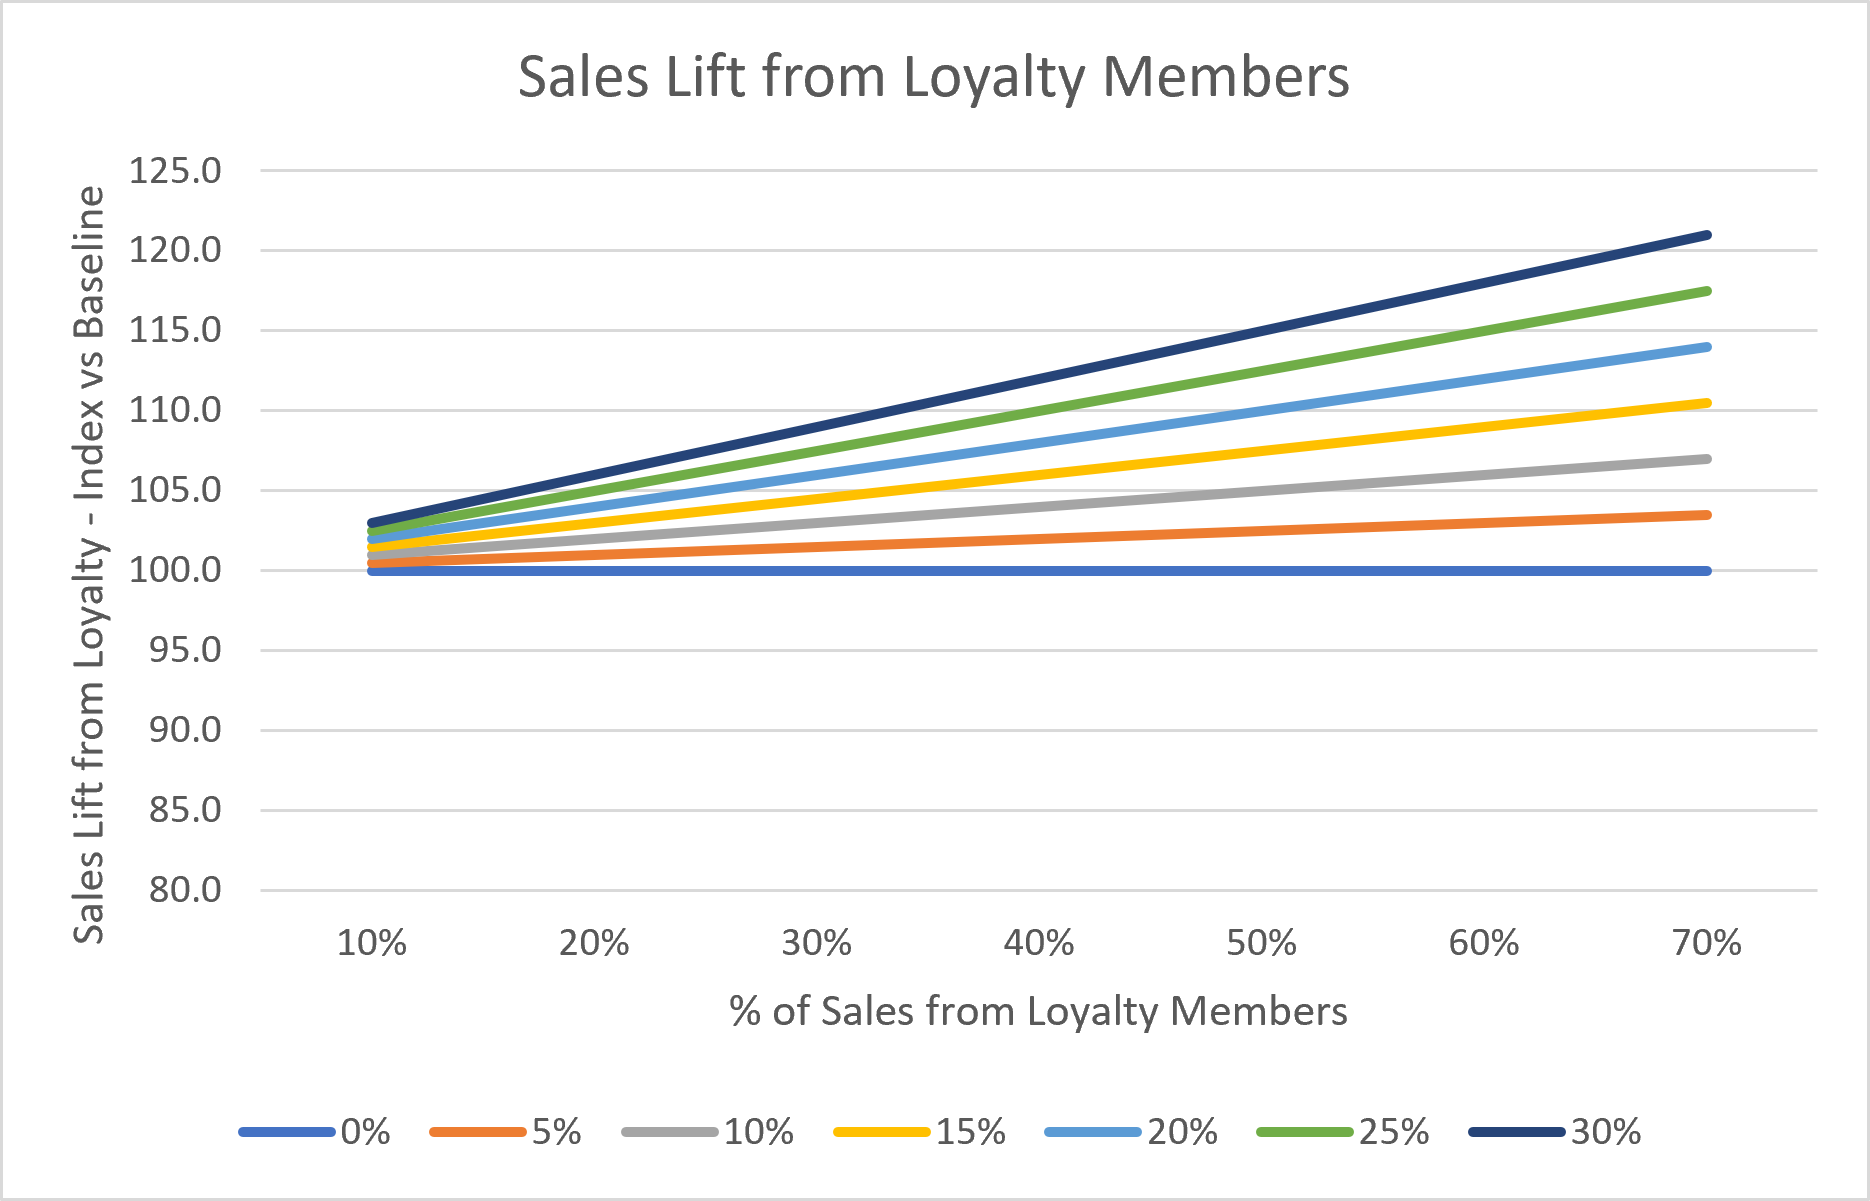
In the chart above, each line represents the impact a given “loyalty lift” would have on topline revenue, depending on the percentage of total sales that come from loyalty members. So even at a 15% lift, and if 40% of sales come from loyalty members (high for most programs), the impact on sales is only +6.0%. That could easily be outpaced by price increases or promotional pricing, meaning it is hard to support the “primary growth driver” positioning from this data. And the 1.8% lift PAR is reporting means a close to flat impact on sales, which is what many of the actual YoY sales results suggested recently.
2. The Post-Redemption Math Is Misleading
According to the PAR report, loyalty member visits jump by 38% in the 60-90 days following an initial reward redemption.
Let's play out the logic: if a substantial portion of your database experiences a massive 38% surge in visit frequency, overall sales should be skyrocketing. Yet, when you look at the total business, the actual lift is completely muted.
Assumptions:
Loyalty members make up 25% of audience
20% of loyalty members are new each year
50% of new loyalty members redeem a reward
Redemptions are spread evenly across the year
Again, pretty simple math. 25% x 20% x 50% = 2.5% of visitors have increased visits, going from 0.61 in 30 days to 0.84 in 30 days (38% increase). Because we assume these are spread evenly across the year, this means 2.5% * 0.23 = 0.58% increase in total visits. Doesn’t have the same impact as claiming a 38% increase.
3. Growth vs. Migration: The Tech-Enforced Bias
The report notes a dramatic Year-over-Year (YoY) divergence: Anonymous sales dropped by 6.7%, while Loyalty sales surged by 32.5%.
At first glance, it looks like loyalty is crushing anonymous business. But ask yourself: is loyalty actually generating new revenue, or is it simply absorbing existing revenue?
As consumers become increasingly comfortable with mobile apps, first-party ordering, and digital kiosks, they are inherently forced to identify themselves. A transaction that would have been "anonymous" at the counter two years ago is now a "loyalty transaction" via an app check-in or in-store kiosk order. The data isn't showing a massive influx of new business; it’s showing a change in consumer ordering habits.
And mathematically, that’s not as impressive as it seems. Since we’re dealing with essentially a zero-sum game here:
Total Sales (100%) = % of Sales from Loyalty + % of Sales from Anonymous
So it becomes easy to solve for the level where a 32.5% increase in loyalty sales and a 6.7% decrease in anonymous sales balance out: if Year 0 loyalty sales account for about 17.5% of total, then Year 1 loyalty sales would jump to about 23%. If we assume a 1.8% overall sales increase, loyalty sales would jump from about 21.5% in Year 0 to 28% of total in Year 1. If we were starting from a place where loyalty made up 40% of revenue, the same changes would lead to a 9% sales increase, which is not what PAR is reporting.
4. Growth Profile: Price Inflation vs. Basket Expansion
The report states that guest check averages grew by 4.38% YoY, while transactions remained closer to flat (+1.6%). The report attributes this momentum to "check expansion" and "thoughtful menu engineering".
However, the report leaves out a critical component: How much of that 4.38% increase was driven by organic basket expansion (guests buying more items), and how much was simply the result of inflationary price hikes, not to mention promotional activity?
Without isolating the impact of these other significant factors, credit is being given to digital upsell strategies and loyalty programs for growth that might just be guests paying more for the exact same order.
The Takeaway for Operators
Loyalty programs are essential operational tools for gathering data, but calling them a primary growth engine based on this dataset is a stretch. The PAR data is actually right in line with what previous analyses have shown: loyalty programs are delivering positive results but with limited impact in a slow-growth environment, even though PAR seems to be drawing different conclusions. Either way, it is critical to set realistic expectations for what a loyalty program, or any marketing initiative, can deliver.
When anonymous transactions drop by 5% and loyalty spikes by 32.5%, yet the final average spend difference between the two is only 1.8%, you aren't looking at a demand generation miracle. You're looking at a structural shift in how orders are placed, which changes how you might attribute success of various marketing tactics.
As always, operators need to build clear financial models to separate organic growth from simple consumer tech migration, and work harder to understand the impact of their loyalty programs.
What are your thoughts? Are you seeing true organic lift from your loyalty members, or is it just shifting buckets? Let's discuss below.
View original on LinkedInWant to discuss this further?
Our team thinks about these problems every day. Let's start a conversation.
Book a discovery call